
How to put CPU and RAM usage on your desktop
Add CPU and RAM widgets to a scene in Scene by Zaweba and they show live readings on the desktop as dials, rings, bars or HUD panels.
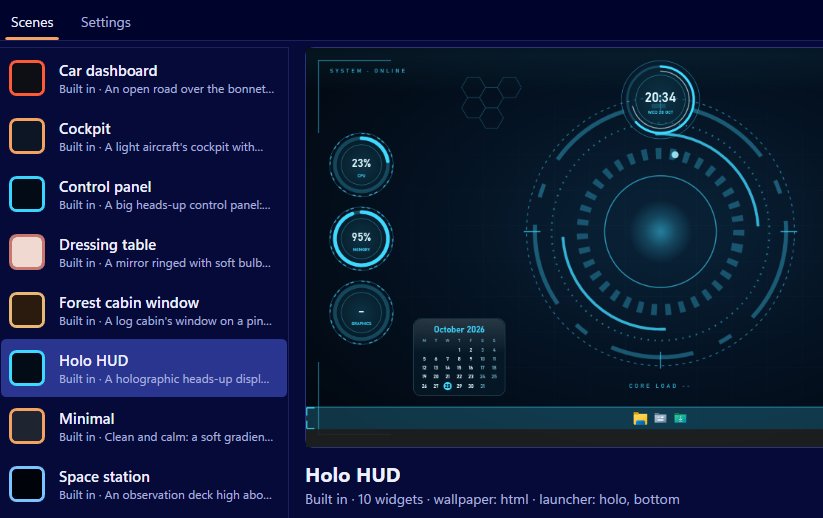
Scene by Zaweba has CPU and RAM widgets you can add to any scene. They read Pulse by Zaweba's figures when Pulse is running, and use Scene's own counters when it isn't, so they work straight away with no extra software and no administrator rights. Add them in the editor or in Arrange mode, choose a skin, and the numbers sit on your desktop under your windows.
The old Windows gadgets are long gone, and a lot of people miss having a quick glance at how busy the machine is. Scene brings that back, dressed to match the rest of your desktop.
Starting with a scene that already has them
Several of the nine built-in scenes show system readings out of the box. In the Car dashboard the speedometer is CPU and the rev counter is memory. In Cockpit the altimeter shows CPU and the airspeed indicator shows memory. Holo HUD and Control panel use glowing rings and heads-up panels for CPU, memory and graphics.
Switch one of those on from the Scenes tab (Switch on or off, or Ctrl+Space) and you have CPU and RAM on the desktop in seconds.
Adding the widgets yourself
To put them on a scene of your own, open it in the editor and add a CPU widget and a RAM widget. For each one you can set a skin, a caption, which monitor it sits on, where it's anchored, its offsets and its size. Built-in scenes are read-only, so if you start from one, Scene > Duplicate gives you a copy to change.
You can also do it on the real desktop. Arrange mode, from the tray menu, the Arrange on desktop button or the Scene menu, puts a frame round every widget and a floating bar with Add widget, Cancel and Done. Drag the new widgets where you want them and resize them with the corner grip. They snap to a 10 pixel grid and to the edges of other widgets, and holding Alt lets you place them freely. Press Done and the positions are saved.
Choosing how they look
Every widget kind works in every skin. A CPU reading can be a dial, an analogue gauge, a ring, a bar, a digital number, a plaque, paper, a HUD panel with cut corners and tick marks, or an image. The widget takes the scene's colours, with an optional highlight colour. If you'd like something truly your own, a widget can use an SVG or PNG face image, including SVGs drawn in Vectornation by Zaweba.
A ring or dial is easiest to read at a glance. A digital figure suits a quieter desktop.
Where the numbers come from
Without Pulse, Scene reads CPU and memory from Windows itself. If Pulse by Zaweba is running, the widgets use its readings instead. Pulse is a separate app that shows CPU, memory, GPU, disk and network use for each program, plus temperatures and fan speeds, and keeps a history.
That's also the answer if you want temperatures or fans on the desktop: those need Pulse. GPU, network and disk space widgets work on their own, and the GPU counter is only read while a GPU widget is showing.
Keeping it useful
Two or three readings are usually enough. CPU and RAM together tell you most of what you want to know about a slow moment, and a disk space widget is handy if your drive tends to fill up. Too many dials and it stops being a glance and becomes a dashboard you have to study, which rather defeats the point.

