
How to analyse server logs for SEO
In SEO by Zaweba, drop an Apache or Nginx access log onto the Logs and Search Console page and click Analyse to see how search engines crawl you.
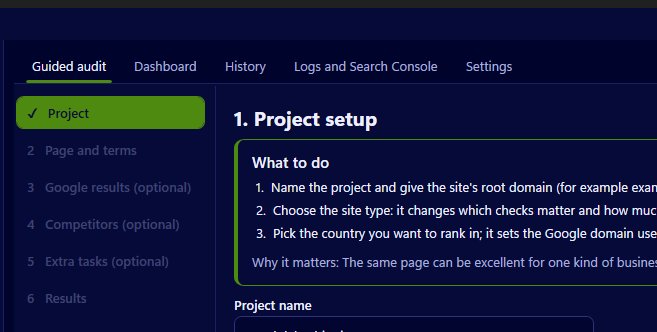
Analysing server logs for SEO starts with one file and one button in SEO by Zaweba. Drop your Apache or Nginx access log onto the Logs and Search Console page, or paste some lines, and click Analyse. The app verifies Googlebot and Bingbot by DNS, then shows crawl per address, a daily chart of hits by status, pages that were never crawled, junk crawling, a status code summary and how new pages are crawled after publishing.
You need a log from a site you look after, because the log lives on the server.
What a log tells you that nothing else does
Crawler tools show what could be crawled. Search Console shows what was indexed and clicked. The access log is the only place that records what search engine crawlers actually requested, line by line, with the date and the status your server returned. For a small site that may only confirm all is well. For a larger one, or a site with filters, feeds and old addresses, it often shows crawlers spending time in places you never meant them to go.
Preparing the log
The combined log format is the default for both Apache and Nginx, and that is what the analyser reads. It accepts plain files, .log, .txt and gzip. Your host's control panel usually has an option to download raw access logs, and step 5 of the guided audit, the extra tasks list, includes access logs for your own sites with exactly where each export lives. A few weeks of data is far more useful than a single day.
Working through the results
Start with the daily chart. It shows crawler hits by status code over time, so you can see whether crawling is steady, whether it dropped after a change and whether errors or redirects rose on a particular day.
Then look at junk crawling. The analyser groups hits on addresses with parameters, on 404 pages and on redirects. A lot of junk means crawlers are wasting their visits, usually because internal links, faceted navigation or old redirects keep feeding them addresses that lead nowhere useful.
Next, read crawl per address and the never crawled list. The first shows which pages get the attention, the second shows which are ignored. Important pages near the bottom, or missing entirely, need more internal links and a place in the sitemap.
Finally, check how new pages are crawled after publishing. If they are picked up within days, your site is in good shape. If not, link to new pages from busy sections when they go live.
Turning findings into fixes
Each finding points at a fix you can make. Repair internal links to 404s and update links that go through redirects. Use robots.txt to stop crawling of parameter addresses that should never be indexed, taking care not to block CSS, JavaScript or real pages; the site crawler will tell you if an important path ends up blocked. Strengthen internal links to the pages crawlers skip.
Logs are most useful beside the other data in SEO by Zaweba. The Search Console import on the same page shows how pages perform in search, and a site crawl shows the internal link graph. When the three agree on a problem page, you can be confident it deserves your time. Run the analysis again after a month to see whether crawling has moved where you want it.

