
How to check page speed and Core Web Vitals
SEO by Zaweba measures LCP, CLS and page weight locally, and adds PageSpeed Insights lab and real user data when you switch on a free key.
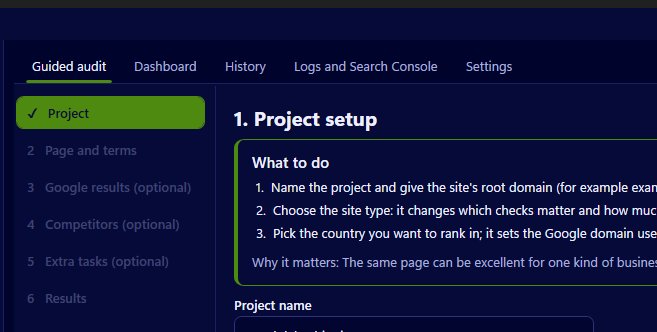
Page speed and Core Web Vitals can be checked inside SEO by Zaweba in two ways. With JavaScript rendering switched on, the app records local Largest Contentful Paint (LCP), Cumulative Layout Shift (CLS) and page weight from its own renderer. Add a free Google PageSpeed Insights key and it also brings in the lab and real user Core Web Vitals for the page, using one request per audit.
The local figures need nothing but the app. The PageSpeed figures need the key, which is optional and off until you add it.
Turning on the local measurements
Open Settings and look under Crawling manners. Render pages with JavaScript uses Microsoft Edge WebView2 to load the page as a browser would, and you can set how long it waits after load. With that on, every page you analyse is read twice, once as raw HTML and once as the rendered page, and the renderer reports LCP, CLS and the page weight.
The single page crawler adds its own timing details from the fetch: time to first byte, total time, size on the wire and unpacked, and whether the response was compressed. It also records the cache-control header. Together these give you a decent picture of why a page feels slow before you reach for anything else.
Adding PageSpeed Insights
Local numbers come from your PC and your connection, so they are a guide rather than what visitors see. For the field view, get a free PageSpeed Insights key from Google and add it in the optional integrations in Settings. Keys are stored encrypted for your Windows account. From then on each audit makes one request and adds the lab results and, where Google has them, the real user Core Web Vitals.
Every feature of the app works without this. It is there for when you want the same numbers people quote in Search Console conversations.
Reading the results
Speed sits in the UX/Speed category, one of the nine the app scores. On the dashboard you can see that category's score against the top-3 average, so you know whether speed is really where you fall behind or whether the pages above you are just as heavy. The All checks tab lists each check with pass, warn or fail, a severity, an effort and a plain reason.
The Comparison tab is useful here too. It puts your page beside each competitor and the top-3 average across about 35 metrics, so a page twice the weight of its rivals stands out.
Fixing what it finds
Large images are a common cause. The image checks report file size, natural size against displayed size, format and lazy loading, which often explains a poor LCP on its own. Missing compression or a weak caching header shows up in the fetch details. Layout shift often comes from images or embeds without reserved space.
Next steps ranks fixes by severity, weight and confidence against effort, so a speed fix only rises to the top when it is likely to matter for your term. Make the change, run the audit again, and the History page will show whether the category score moved.

