
How to see which pages Googlebot crawls on your site
Drop your Apache or Nginx access log into SEO by Zaweba and it shows, page by page, what verified Googlebot crawled and what it never touched.
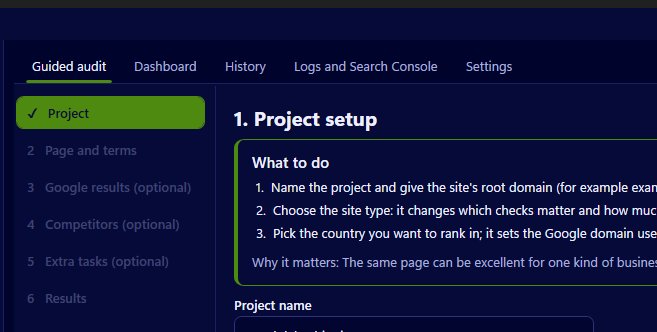
Your server's access log is the only record of exactly which pages Googlebot asked for. SEO by Zaweba reads it for you: drop an Apache or Nginx access log onto the Logs and Search Console page and click Analyse. Googlebot visits are verified by DNS, so impostors are left out, and the results show the crawl for each address, the pages that were never crawled and how quickly new pages were picked up.
This is for your own sites, since you need the log from the server.
Getting hold of the log
Most hosts keep access logs in the control panel or in a logs folder you can reach over FTP. Step 5 of the guided audit, the extra tasks list, includes access logs for your own sites and says exactly where each export lives, so you don't have to hunt. The analyser accepts the combined log format that Apache and Nginx use by default, as a plain file, a .log or .txt file, or gzip. If you only have a few lines, you can paste them in instead.
A longer log gives a fairer picture. Googlebot doesn't visit every page every day, so a few weeks of log is better than an afternoon.
Reading crawl per address
After Analyse, the results list each address with the hits it received from verified crawlers. This is where you see what Googlebot actually spends its time on. Often the answer is a surprise: a handful of key pages visited rarely, while old feeds, search result pages or addresses with tracking parameters soak up the attention.
The never crawled list is just as useful. Pages that are on your site but did not appear in the log at all in the period are pages Google is not looking at. Compare them with your sitemap and with the internal link graph from a site crawl, because pages with few or no internal links are the usual suspects.
New pages and status codes
The analyser also shows how new pages are crawled after you publish them, which tells you how quickly your site's changes reach Google. A daily chart shows hits by status code, and a status code summary sits beside it. A rise in redirects or errors on a particular day often lines up with a site change, and spotting it in the chart is much faster than reading raw lines.
Acting on what you see
If important pages are rarely crawled, give them more internal links from pages that are crawled often, and make sure they are in the sitemap. If crawling is wasted on junk addresses, the analyser lists junk crawling separately (parameters, 404s and redirects), so you can tidy internal links that create them and block what should never be crawled in robots.txt. If new pages are slow to be picked up, link to them from the home page or a busy section when they go live.
SEO by Zaweba's log page sits beside its Search Console import for a reason. The log tells you what Google crawled, the Search Console data tells you what it showed and what people clicked, and the two together explain far more than either on its own. The analysis stays on your PC, along with the rest of the app's data.

